Figure 7.
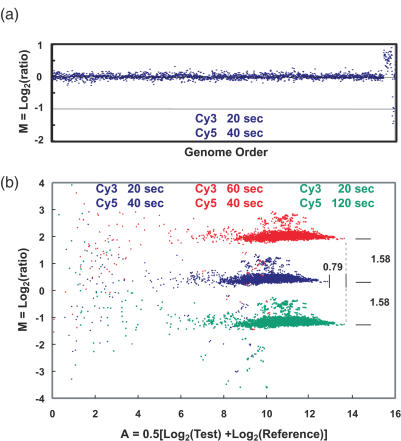
(a) Array CGH comparison of genomic DNA from a normal female to a normal male using a microarray containing BAC clones mapped to ∼2500 loci distributed across the genome. Each point represents the average value of M = Log2(ratio) for the triplicate array elements for each locus, plotted according to its order in the genome. The elevated points to the right are X chromosome loci, and the low points at the very far right are on the Y chromosome. No computational corrections to the images or data, other than an overall normalization so that the median value of M = 0, were applied to the images or the data. Exposure times for the Cy3 and Cy5 images are indicated. (b) ‘M versus A’ plots for all 7500 elements on the array for images acquired with different exposure times. ‘A’ is a combined measure of the Test and Reference intensities as indicated on the plot. Blue points indicate data from the images used for (a), which were obtained with our ‘standard’ exposure times. The points above the main band correspond to X chromosome loci, while the few falling below map to loci on the Y. Small clusters of three points can be seen, which are produced by the triplicate elements for each locus. Points in red and green show the results when exposures of the Cy3 or Cy5 have been increased by a factor of 3. Exposure times are shown with a color code to match the data points. The locations of the data points move by exactly the amount expected, ΔM = Log2(3) = 1.58, ΔA = 0.5Log2(3) = 0.79, as indicated on the plot. Note that the plots for the different exposure times have the same distribution of points to very high accuracy, as can be seen, for example, by the reproducibility of the relative positions of the measurements of loci that fall outside the main cloud. Independent sets of Cy3 and Cy5 images were obtained for each analysis. The data points represent background-corrected intensities obtained directly from the images without computational adjustment or overall normalization.

