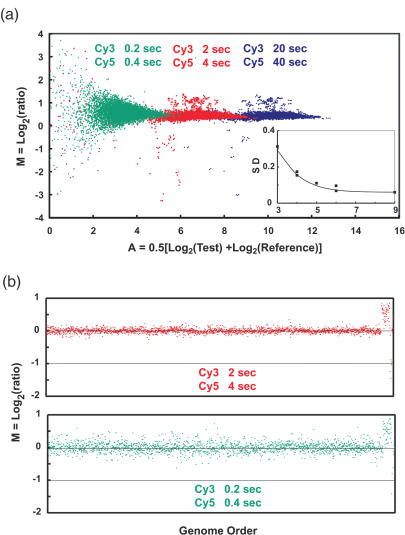
Figure 8.
Dependence of measurement precision on signal intensity. (a) M versus A as a function of reduced exposure times. Data from three sets of exposure times, our standard and two steps of 10-fold reduction of both Cy3 and Cy5, are shown for the same array as in Figure 7. Each point represents one element (∼7500 total) on the array, its color matching the exposure times shown at the top of the figure. Within each exposure the intensities of the elements range over 4 U in A as in Figure 7, and between exposures they decrease by exactly the expected factor of 10. Careful examination of the points that are individually distinguishable in the two highest exposure times show that they have nearly identical relative locations, indicating very low random noise in the entire analytical process. However, broadening in M is clearly seen at the lowest exposure for those elements on the array where the intensity is <A = 5–6. No computational adjustments have been made to these data. The inset shows the standard deviation of the Log2Ratio, (standard deviation of M), as a function of A. The points were obtained from an analysis of the data in the main figure, and the line is based on a model that includes photon counting statistics and camera readout noise as the only sources of random variation in the measurement (Supplementary Data). The calculation indicates that camera readout noise makes the dominant contribution to the measurement uncertainty because the array elements are large enough so that their total light emission is sufficient to make photoelectron shot noise less important until even lower intensities. Note that in these measurements the background intensity is effectively zero, since it is reduced proportionally to the signals as the exposure times are reduced. Thus they do not accurately simulate an actual measurement situation. An enlarged view of this inset, including additional curves modeling the effects of constant background levels as well as very small array elements, is shown in Figure 9. (b) Copy number profiles for the data from the two lowest exposures. The profile (red points) is very similar to that of Figure 7a, which was obtained with a 10-fold higher exposure time. The profile for the lowest exposure clearly shows broadening, and many points have been removed by quality control filtering. Even so, the basic copy number features are clearly present with exposures that are 100-fold lower than ‘standard’.

