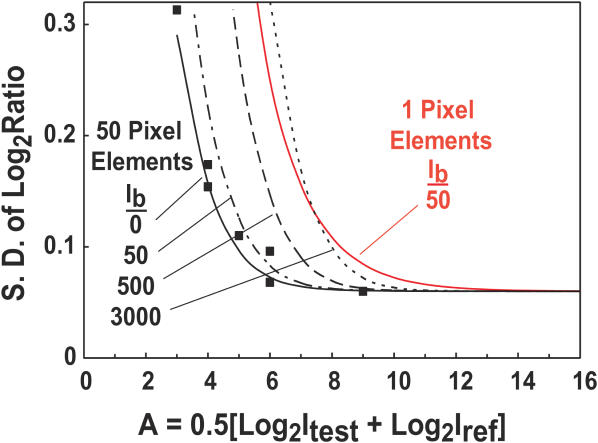
Figure 9.
Estimation of ratio measurement precision for different conditions. The closed square boxes indicate measured values of the standard deviation of the Log2(ratio) as a function of Log2(intensity), A, from the data in Figure 8a. The ‘intrinsic’ variation in this array, as determined by the standard deviation measured at high intensity, is 0.06. The solid black line shows the behavior of the model calculation using the camera and array parameters appropriate for these measurements. The data points and predicted behavior are also shown in the inset of Figure 8a. In these measurements the background intensity is effectively 0, since it is reduced proportionally to the signals as the exposure times are reduced to get the low intensity signals. This is not an accurate simulation of a true measurement because detection of truly weak signals requires longer exposures and their concomitant higher backgrounds. The black dotted lines indicate the expected measurement precision for background light levels of 50, 500 and 3000 digital units. For typical exposures one expects minimum backgrounds of ∼ 50–100 based on the data in Figure 2. Thus when the signal intensities are ∼62 digital units (A = 6) above the background, the measurements approach 0.06, the ‘intrinsic’ variation in the array in this simulation. The solid red line simulates the expected measurement resolution for an array in which all of the light from an array element is collected in one pixel, background is determined from 15 nearby pixels, and the background level is 50 digital units. The standard deviation of the Log2ratios is predicted to be <0.1 for intensities >∼300 digital units above background.

