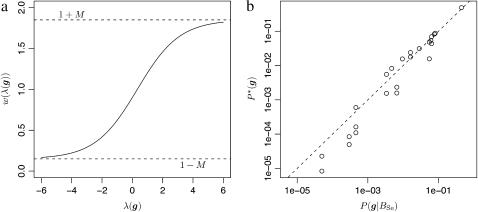
Figure 2.
The importance sampling scheme I2. (a) The logistic weighting function w(λ(g)) as a function of λ for M = 0.75 and r = 0.72. The dashed lines show the minimum and maximum possible values of w(λ(g)). (b) Plot of P(g | BSe, μ) for a single locus with q = 0.2 on the x-axis against P*(g), obtained by weighting values of P(g | BSe, μ) by the function in a, on the y-axis. The dashed line is the y = x line.

