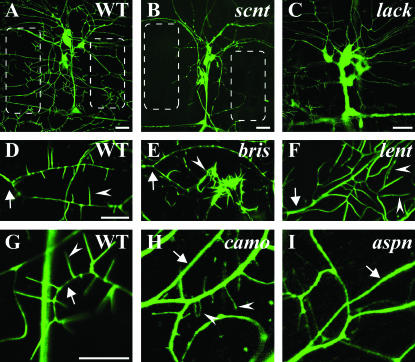
Figure 4.
Representative second instar larval dendrite phenotypes of the three mutant classes: class 1, dendrite outgrowth/branching; class 2, dendritic filopodia formation; class 3, actin∷GFP localization. (A, D, and G) Representative images of actin∷GFP localization, dendritic branching/outgrowth, and filopodia formation in wild-type larvae. (B) The scnt mutant demonstrates a class 1 phenotype with a major reduction in dendrite outgrowth and branching. Note the regions devoid of dendrites in scanty (B, outlined boxes) compared to wild type (A, outlined boxes). (C) The lackluster (lack) mutant (class 3) displays relatively faint localization of actin∷GFP in dendrites and filopodia compared to cell bodies (visible with increased image exposure; compare ratios to A). (E) The bris mutant represents a class 2 phenotype displaying greatly increased filopodia formation at the tip of neuron ddaA. However, dendritic branching is unaffected and the same dendrite branch can be observed in both bristly (E, arrow) and wild type (D, arrow). (F) The lengthy (lent) mutant (class 2) displays longer filopodia (arrowheads) at the tip of neuron ddaA. (H) The camo mutant represents a class 3 mutant containing filopodia only faintly labeled by actin∷GFP in a ddaA neuron (visible with increased image exposure). Note the ratios of fluorescent intensity in wild-type dendrites (G, arrow) to filopodia (G, arrowhead) compared to the fluorescent intensity of camouflaged dendrites (H, arrow) to filopodia (H, arrowheads), indicating decreased actin∷GFP localization in camouflaged mutants. (I) The aspiny (aspn) mutant (class 2) displays greatly reduced filopodia numbers, particularly evident on a dendrite (arrow) devoid of filopodia. Bars, 20 μm (A–C) and 10 μm (D and G).

