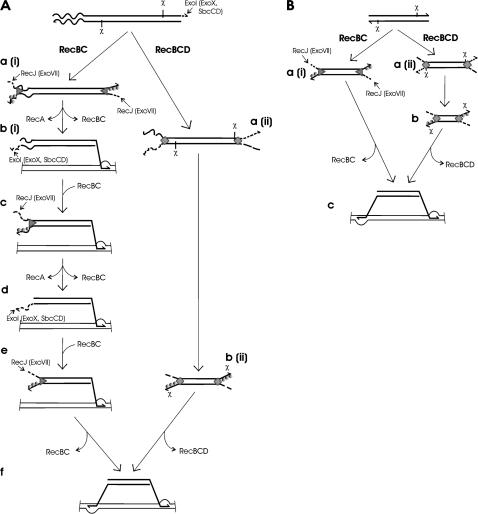
Figure 2.
Model for transferred donor DNA (depicted by thick lines) processing in recD and wild-type Hfr transconjugants (A) and P1 transductants (B). Wavy and thin lines represent F plasmid DNA and recipient chromosome, respectively. RecA, RecBC, and RecBCD proteins are shown as a circle, triangle, and rectangle, respectively. Details of the reactions at each stage are described in the text.

