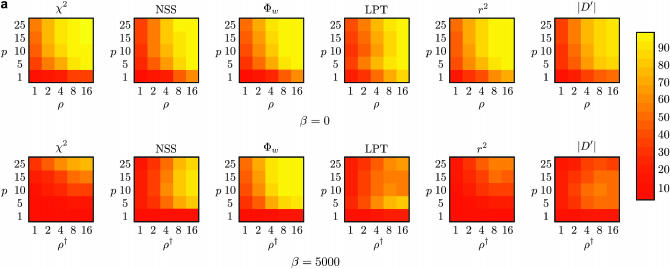
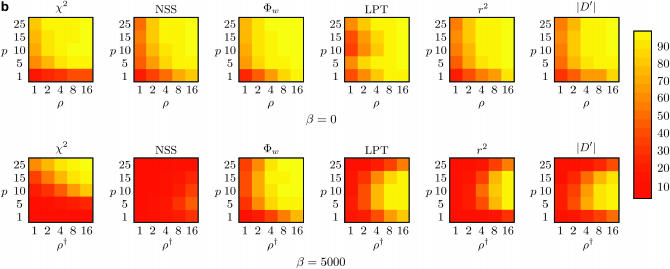
Figure 4.
Power to detect recombination for (a) m = 10 and (b) m = 50 samples for six different methods with (a and b, bottom rows) and without (a and b, top rows) population growth. The horizontal axis varies the rate of recombination whereas the vertical axis varies the amount of sequence diversity. Each cell represents the outcome of 1000 replicates with cells with lighter shading indicating increased power. The value ρ† refers to the value of ρ used to give the same expected number of recombinations under population growth.


