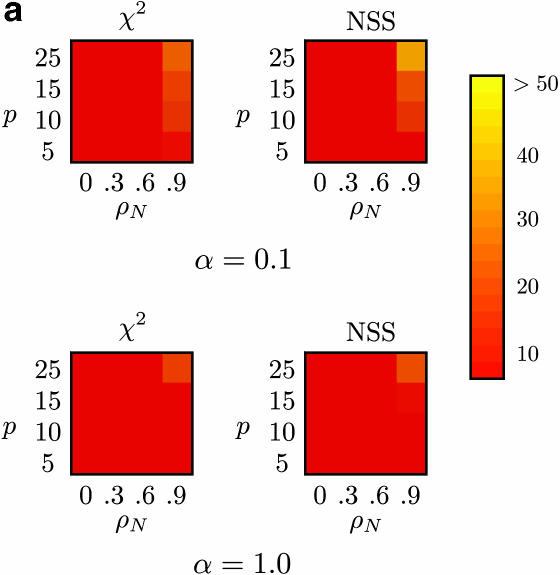
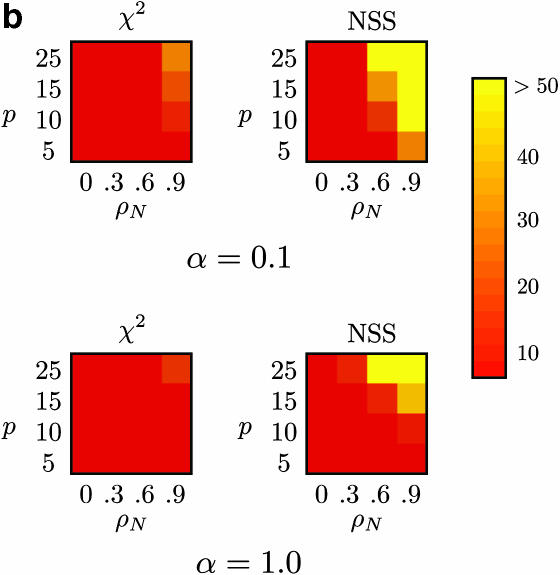
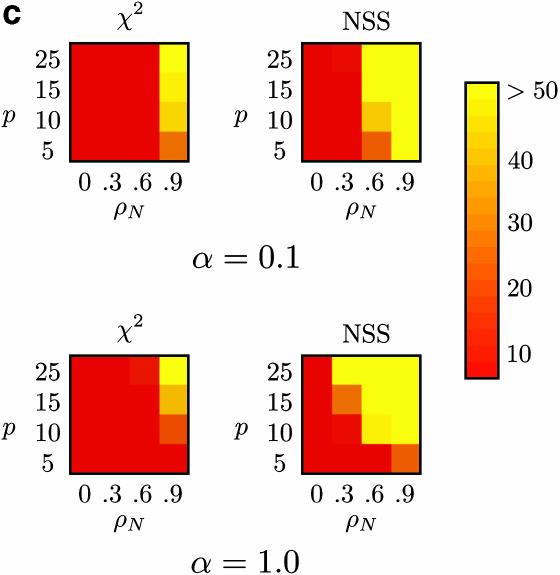
Figure 5.
Percentage of false positives for (a) m = 10 samples (with β = 5000), (b) m = 50 samples (with β = 0), and (c) m = 50 samples (with β = 5000), for Max χ2 and NSS, with extreme rate heterogeneity (top row) and moderate rate heterogeneity (bottom row). The horizontal axis varies the substitution rate correlation whereas the vertical axis varies the amount of sequence diversity. Each cell represents the outcome of 1000 replicates with cells with lighter shading indicating a higher percentage of false positives. The results for Φw, r2, and |D′| are omitted since these approaches did not falsely infer recombination >7% of the time for any of the conditions, but Table 4 shows a number of these results for Φw.


