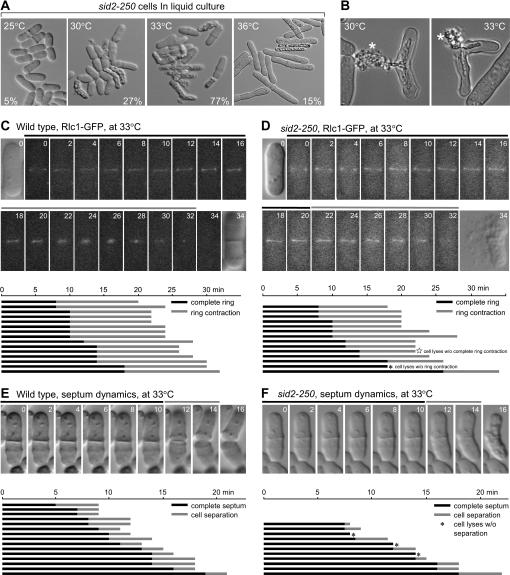
Figure 2.
Characterization of the cell lysis phenotype in sid2-250 cells at lower restrictive temperature. (A) sid2-250 (YDM429) cells show different lysis phenotypes at high and low restrictive temperatures. Mutant cells were first grown in liquid medium at 25° to log phase and then shifted to 30°, 33°, and 36° for 4 hr before images were collected using DIC microscopy. The percentages of lysed cells in each culture are shown. (B) Two representative cells of sid2-250 (YDM429) after being incubated at 30° and 33° for 4 hr. Both cells showed the cell lysis at the septum area, and the released cell contents are labeled with asterisks. (C and D) The dynamics of actomyosin ring formation were followed in (C) wild-type (YDM1264) and (D) sid2-250 (YDM1374) cells by monitoring the Rlc1–GFP signals at 33°. Live images were taken as described in materials and methods. The time point when the signal first appeared as a ring was set as T0 and numbers indicate the minutes afterward. The times of ring formation, maintenance, and contraction were measured from live cell movies. Bars denote the periods of ring formation and maintenance (solid) and ring contraction (shading). (C and D, top) Sample images from one wild-type and one sid2-250 cell selected at random, with the first and last images taken using DIC microscopy, and the rest showing Rlc1p–GFP fluorescence. (C and D, bottom) Actomyosin ring formation and contraction in (C) 15 wild-type and (D) 14 sid2-250 cells. All selected wild-type cells showed septum formation and all selected sid2-250 cells eventually lysed. (E and F) The septum dynamics were followed in (E) wild-type (YDM1264) and (F) sid2-250 (YDM1374) cells by DIC microscopy at 33°. The time point when the complete septum was assembled was set as T0 and numbers indicate the minutes afterward. Cells were judged to have complete septa when focusing up and down revealed no gaps in the middle. The times of septum maintenance and degradation were measured from live cell movies. Septum degradation was measured from the time cell separation begins to when the cells separate or lyse. Bars denote the periods of septum maintenance (solid) and septum degradation (shading). (E and F, top) Samples of (E) wild-type and (F) sid2-250 cells. (E and F, bottom) Septum formation and degradation in 15 wild-type and 11 sid2-250 cells. All selected wild-type cells showed successful septum degradation and all selected sid2-250 cells eventually lysed before or during septum degradation.

