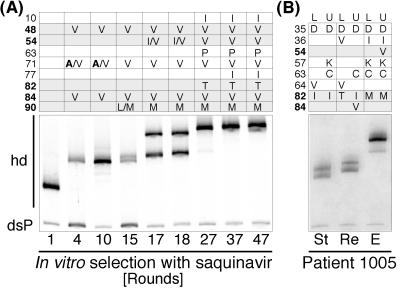
Figure 5.
Longitudinal study of viral pro subpopulations under the selective pressure of protease inhibitors in vitro and in vivo. (A) The MSS HTA of nine different passages of a virus culture that was subjected to increasing concentrations of saquinavir. The stepwise shift of the MSS HTA bands to higher positions can be seen and this shift correlates with an increasing number of resistance mutations seen in bulk sequences derived from proviral DNA. Positions highlighted in gray are target positions of the MSS probe. Two amino acids indicate a mixed population. hd, heteroduplex; dsP, double-stranded probe. (B) Patient 1005 was followed during a trial of ritonavir from the start of monotherapy (St, day 1), through to the first timepoint of rebound of viral RNA after initial response (Re, day 114), to the endpoint of the trial (E, day 228). The pro sequences of molecular clones corresponding to different populations are indicated (L, lower band; U, upper band). Again, the target positions of the MSS HTA probe are highlighted in gray. Note that the L63C mutation represents a change of three nucleotides (CTC to TGT) which likely leads to a mobility shift.

