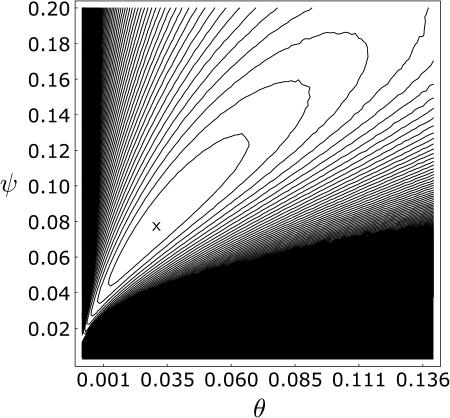
Figure 5.
The log-likelihood surface for the Pacific oyster data of Boom et al. (1994), estimated over a grid of points for ψ and θ using simulations. The maximum likelihood occurred at two adjacent points, which are covered by a single x. Contour lines are drawn every two log-likelihood units from the maximum.

