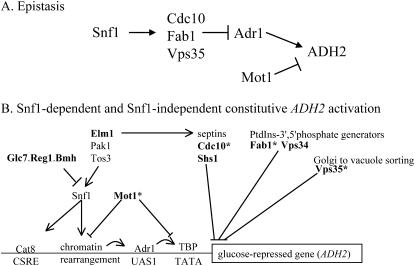
Figure 9.
Interactions between factors affecting ADH2 expression. (A) Epistasis relationships between ADR1, SNF1, and CDC10, FAB1, VPS35, and MOT1 in ADH2 expression. Positive and negative interactions are shown by arrows and bars, respectively. (B) A model of ADH2 expression incorporating new regulatory genes. Boldface type indicates mutants are ADH2-constitutive. The asterisks indicate mutants isolated in this screen or in accompanying studies.

