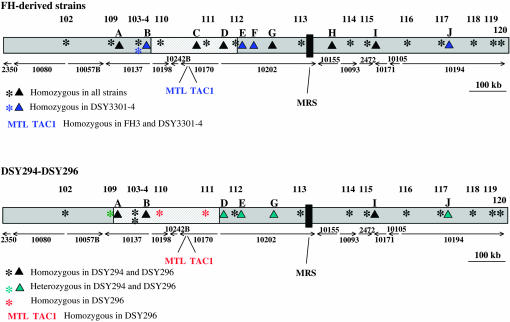
Figure 8.
SNP analysis of chromosome 5. The map of chromosome 5 was obtained by assembly of the different contig sequences shown by arrows. An asterisk (*) indicates SNPs of chromosome 5 as measured on the SNP microarray: 102, 1855/2172; 103, HST3; 104, SNF1; 109, 1899/2008; 110, 1445/2395; 111, 1922/2344; 112, PDE1; 113, 1969/2162; 114, DPH5; 115, HEX1; 116, 2093/2390; 117, 1817/2082; 118, 1341/2493; 119, F16n1; 120, 2340/2493. “▴” indicates additional markers of chromosome 5: A, orf19.1976 (TRX1); B, orf19.1926; C, ZNC3; D, orf19.4225; E, orf19.4251; F, orf19.4288; G, orf19.1942 (TRR1); H, orf19.2646; I, orf19.6680; J, CRH12. Color codes indicate modifications in SNPs for individual strains. For the strains DSY294 and DSY296, sequences of the C, F, and H markers were not available. The hatched regions on chromosome 5 delimitate the maximal region of a recombination. MRS, major repeat sequence.

