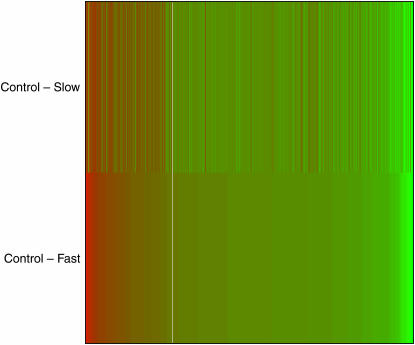
Figure 4.
Genes that are differentially expressed with inbreeding (either fast or slower) are mostly responding in the same direction. The heat diagram shows color-coded gene expression profiles in which rows correspond to treatment comparison (control vs. slow, control vs. fast) and columns correspond to genes. Genes are sorted by differential expression in the control vs. fast comparison. The heat diagram was drawn using the R package limma (Smyth 2004).

