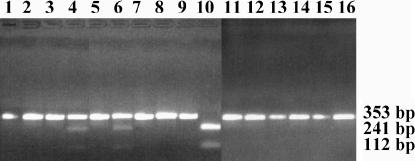
Figure 5.
Gel electrophoresis of PCR-amplified products to quantify the level of transcription from the B chromosome. All PCR products were amplified using P1 and P2 with the reverse transcriptase step included for samples in lanes 11–16 and all RNA samples digested with DNase. All samples are in pairs not digested (odd numbers) and digested with NsiI (even numbers). Total plant DNA from 0B (lanes 1 and 2), 2B (lanes 3–6), clone 10 DNA from 0B (lanes 7 and 8), clone 3 from microdissected B chromosome DNA (lanes 9 and 10), total flower bud RNA from 2B plant (lanes 11 and 12), and total leaf RNA from 2B plant (lanes 13–16). Fragment sizes are indicated in base pairs.

