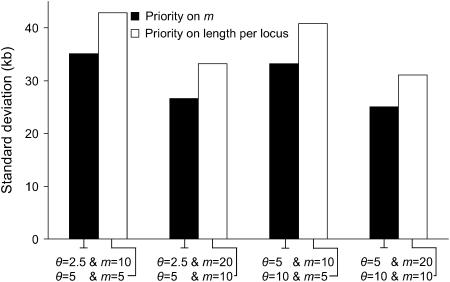
Figure 6.
Standard deviation of the estimated position of the selected site for different sequencing strategies (m vs. length of marker locus). The solid bars represent the cases with more loci and a shorter sequence per locus. The open bars represent the alternative strategy (such that the sequencing load in both cases is identical). Parameter values are the same as in Figure 3. LPS2 is used.

