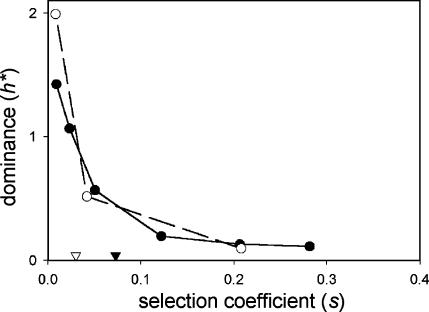
Figure 5.
Dominance of growth rate effects of deletions of genes whose products participate in protein complexes (solid line and solid symbols) and all other genes (dashed line and open symbols). Mean s-values for the two categories are indicated by triangles. See Figure 2 for details.

