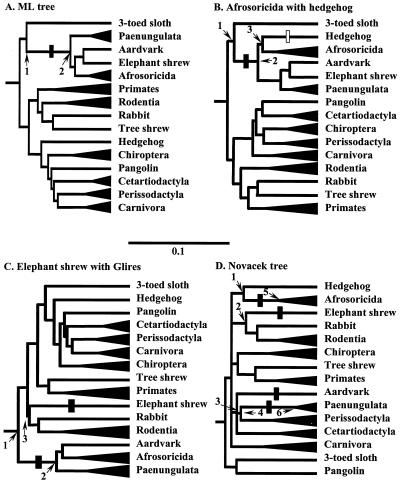
Figure 2.
Alternative topologies used to calculate the likelihood of the CRYAA signature. Trees are constructed from a 5,708-bp concatenation of six genes representing the species as indicated by * in Fig. 1 A and D, using kangaroo and opossum as out-group. (A) Unconstrained ML tree. (B) Tree enforcing the association of Afrosoricida (Madagascar hedgehog and golden mole) with hedgehog. (C) Tree constrained to group elephant shrew with Glires. (D) Tree constrained to conform with morphological relationships of eutherian orders as proposed by Novacek (11). All trees present internal branch lengths proportional to likelihood; terminal branches are shortened, and related species combined (Paenungulata: African elephant, manatee and hyrax; primates: galago and human; Rodentia: mole rat and guinea pig; Chiroptera: fruit-eating bat and flying fox; Cetartiodactyla: minke whale, cow, and pig; Perissodactyla: rhinoceros and horse; Carnivora: mink and seal). Filled and open bars indicate where the QLLC signature is assumed to have evolved and disappeared, respectively. In B it is equally parsimonious to have the signature evolve twice, in the ancestor of Afrosoricida and the aardvark-elephant shrew-paenungulate clade, respectively. For complete CRYAA trees and corresponding AQP2 and IRBP trees see Fig. 6. The estimated posterior probabilities of observing the signature QLLC at the numbered nodes are (B) ≈0.0, 0.820, and 0.796 at nodes 1, 2, and 3; (C) ≈0.00, 0.982, and ≈0.00 at nodes 1, 2, and 3; (D) ≈0.0 at nodes 1–4, and 0.923 and 0.507 at nodes 5 and 6, respectively.

