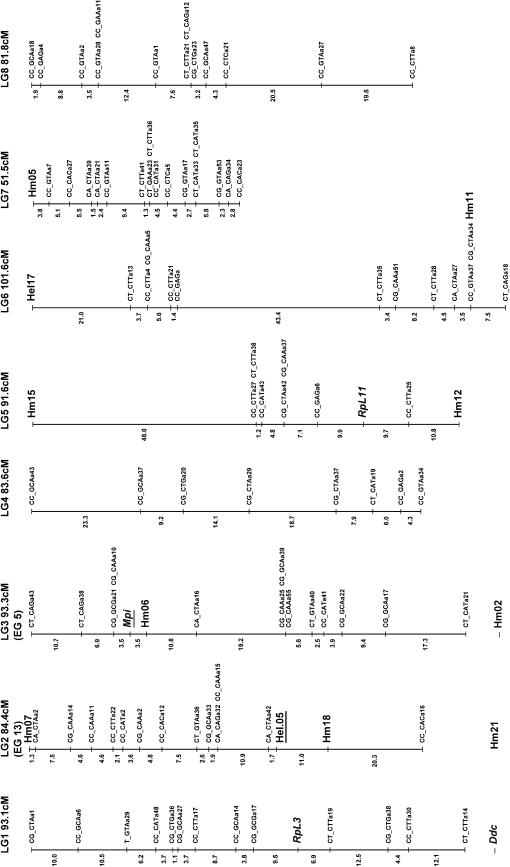
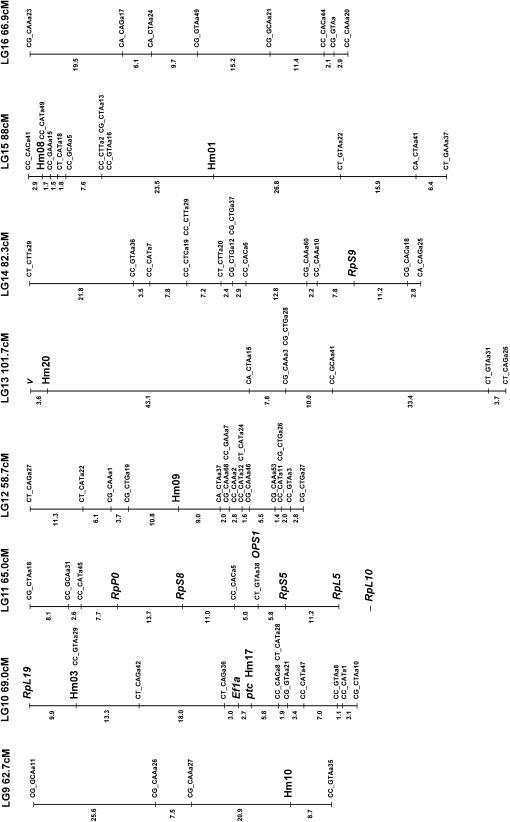
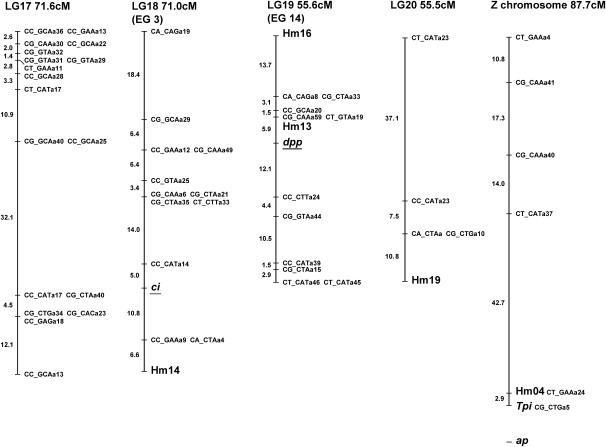
Figure 3.
Linkage map of H. melpomene. Microsatellite and SCNP markers are shown in larger type, using standard gene nomenclature for the latter. All remaining markers are AFLPs and are coded with the two selective EcoRI nucleotides, followed by the three selective MseI nucleotides, and finally an identifier code; e.g., CT_CAGa38 is band a38 scored from the EcoRI-CT MseI-CAG primer combination. Markers assigned to linkage groups for which there is no information on map position are shown separately below the linkage group. Possible homology with linkage groups in H. erato is shown in parentheses below each linkage group number with the H. erato linkage group number; e.g., linkage group 2 (LG2) corresponds to linkage group 13 in H. erato (EG13; see Tobler et al. 2004) on the basis of the shared Hel.05 marker. These comparisons are based on a single marker in each case so chromosomal homology is tentative. The marker used to establish homology is underlined in each case.


