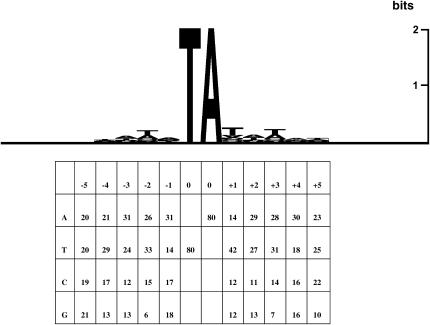
Figure 3.
Sequence composition analysis of Minos insertion sites. (Top) Five nucleotides upstream and downstream of the insertions were aligned for 80 integrants and their informational content was plotted with the SeqLogo program (Schneider and Stephens 1990). (Bottom) Base distribution of the 80 insertion sites.

