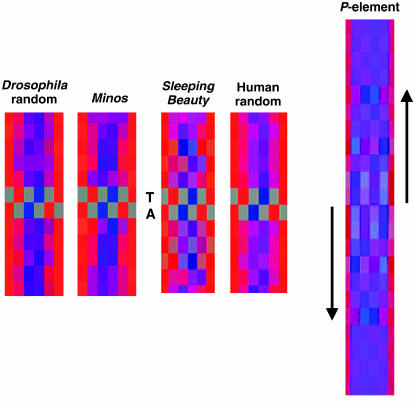
Figure 5.
Hydrogen-bonding analysis of Minos insertion sites compared to Sleeping Beauty and P-element insertion sites. Program HbondView (Liao et al. 2000) was used to illustrate average hydrogen-bonding patterns of base pairs flanking the Minos insertion sites. Six positions for each base pair are color coded as potential hydrogen acceptor (red), donor (blue), or inert (gray). Sleeping Beauty and P graphs are from Liao et al. (2000) and Vigdal et al. (2002), respectively.

