Figure 1.
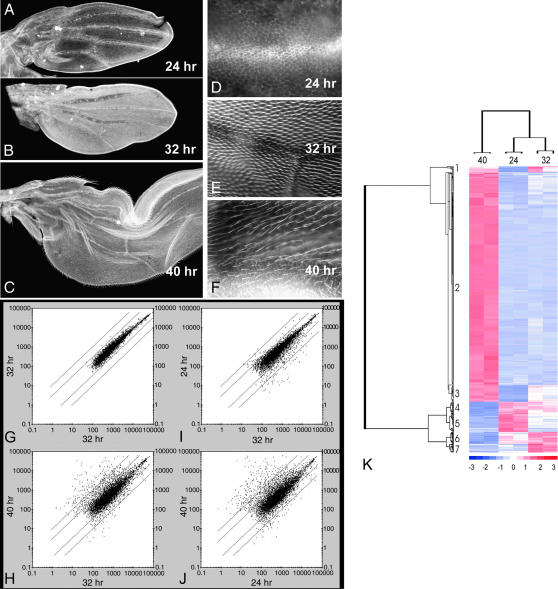
Gene expression during wing differentiation. (A–C) Low-magnification images of 24-, 32-, and 40-hr pupal wings stained with a fluorescent phalloidin. All images are shown at the same magnification. The flattening of the wing cells results in the increased size of the wing at 40 hr vs. 32 hr. (D–F) Higher-magnification images of the same wings. Note that at 24 hr no hairs have started to form, at 32 hr short bright staining hairs are visible, and at 40 hr the hairs are longer, thinner, and do not stain quite as brightly as at 32 hr. (G–J) Scatter plots from Affymetrix gene chip experiments. Only genes/RNAs scored as present are plotted. The diagonal lines represent 3- and 10-fold differences in expression. (G) Replicate experiments for 32-hr wing RNA. Note the good agreement in expression levels in the 32-hr replicates. H–J show 24 hr vs. 32 hr, 40 hr vs. 32 hr, and 40 hr vs. 24 hr. As might be expected the greatest differences are seen in the 40-hr vs. 24-hr plot. Note that more genes show highly increased levels of expression at 40 hr than at 24 hr. (K) The clustering analysis (from Dchip) for the replicate 24-, 32-, and 40-hr samples. Only genes whose expression changed fivefold (P = 0.05) are included. Note that more than two-thirds of the genes that show substantially higher expression at 40 hr than at 24 hr or 32 hr fall into group 2. Note also that the 24- and 32-hr expression patterns cluster together compared to the 40-hr pattern.

