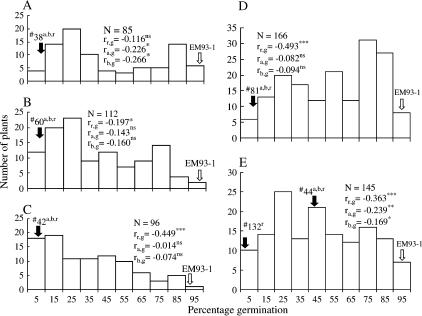
Figure 2.
Distribution of percentage of germination for the five populations (see Figure 1). (A) F1 (EM93-1/F2 no. 14a,b,r) (20 DAR). (B) BC1F1 (EM93-1/F1 no. 38) (10 DAR). (C) BC2F1 (EM93-1/BC1F1 no. 60) (10 DAR). (D) BC3F1 (EM93-1/BC2F1 no. 42) (10 DAR). (E) BC4F1 (EM93-1/BC3F1 no. 81) (7 DAR). The open and solid arrows indicate germination levels for the recipient parent EM93-1 and the plant selected as the parent to develop the next generation, respectively. Superscripts indicate if the selected plant had awn (a), black hull color (b), and/or red pericarp/testa color (r) characteristics. N is the population size, and rr,g, ra,g, and rb,g are correlation coefficients between the characteristics red pericarp color (r), awn (a), and black hull color (b) and the percentage of germination evaluated at the specified days of after-ripening (DAR), respectively; the superscripts indicate the correlations were nonsignificant (ns) or significant at the 0.05 (*), 0.01 (**), and <0.0001 (***) probability levels.

