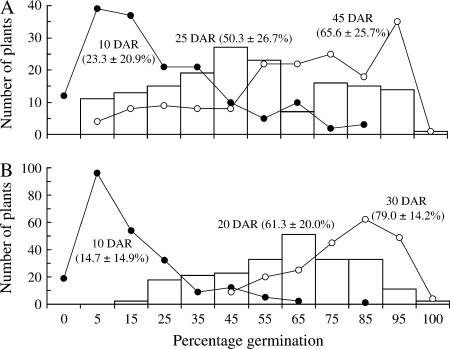
Figure 4.
Distribution of percentage of germination for the BC4F2 132 (N = 160) (A) and 44 (N = 230) (B) populations. Mean and standard deviation for germination evaluated at 10 (solid circles), 20 or 25 (open columns), and 30 or 45 (open circles) days of after-ripening (DAR) are shown in parentheses.

