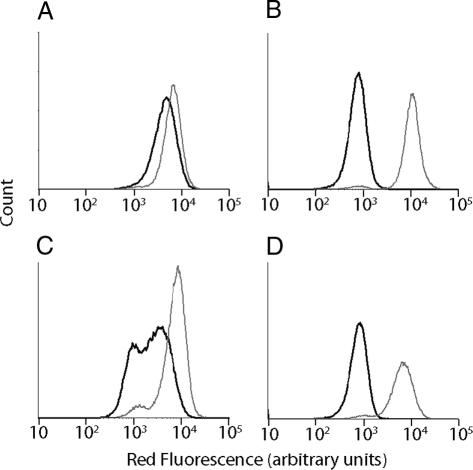
Fig. 2.
Measurement of substrate conversion by FACS. Flow cytometry analysis of bacterial cell populations displaying either linker (GGSGGS) (A) or canonical substrate (DDDDK) (B) before (gray line) and after (black line) treatment with enteropeptidase. During library screening for enteropeptidase substrates, cell populations collected from screen 1A (C) and screen 3B (D) were analyzed by flow cytometry before (gray line) and after (black line) enteropeptidase treatment. The loss of fluorescence due to treatment, shown by the shift in the black line, demonstrates enrichment of enteropeptidase substrates after screen 3B (D).

