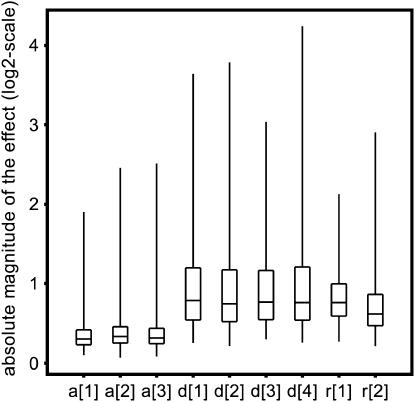
Figure 3.
Box plots displaying the absolute magnitude of the estimated composite additive ([a]), dominance ([d]), and reciprocal effects (r) on the log2 scale. a[1], a[2], and a[3] were estimated as half the expression difference between Col and Ler, Col and Cvi, and Ler and Cvi, respectively; d[1], d[2], d[3], and d[4] were estimated from the contrasts of the hybrids Col × Ler, Ler × Col, Ler × Cvi, and Cvi × Ler, respectively, vs. the corresponding midparent value; r[1] and r[2] were estimated from the contrasts Col × Ler vs. Ler × Col and Ler × Cvi vs. Cvi × Ler, respectively.

