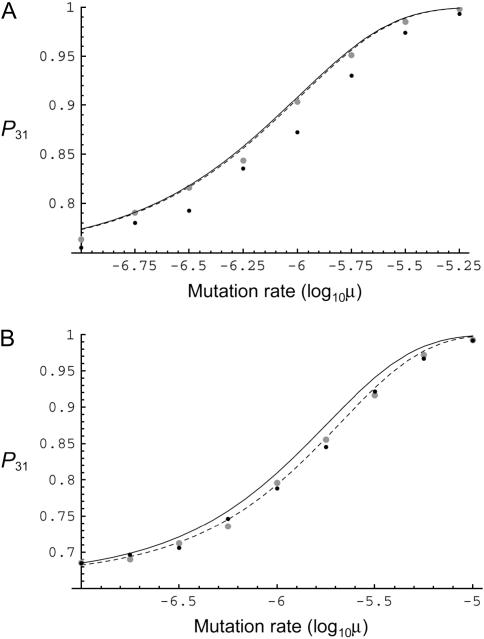
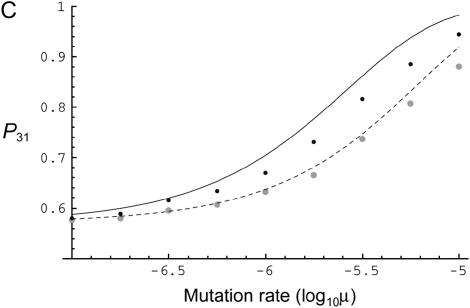
Figure 1.
Transition probability to the fittest allele for i = 3. The solid curve shows P31 for zero recombination as a function of mutation rate given by Equations 5 and 9. The dashed curve is that for free recombination, given by Equation 8. Solid (shaded) circles represent simulation results for an asexual (sexual) population. Simulation results were averaged over 5000 replicates. N = 2 × 10⁴. (A) s1 = 0.06, s2 = 0.02; (B) s1 = 0.04, s2 = 0.02; and (C) s1 = 0.04, s2 = 0.03.


