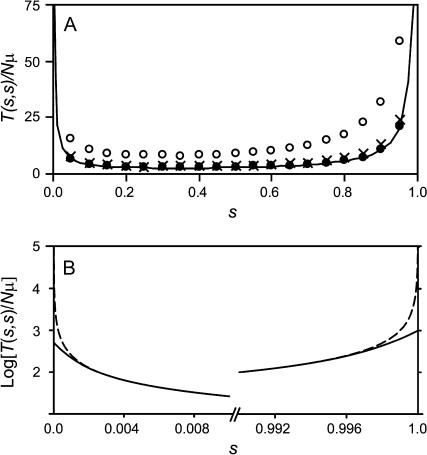
Figure 2.
Sensitivities of two-locus model as a function of s ≡ s00→10 = s00→01. Time is given in units of Nμ generations. (A) Equation 3 is shown as a solid line, and individual-based simulation results allowing back mutations are shown for Nμ = 0.001, 0.01, and 0.1 (solid circles, crosses, and open circles, respectively), with N = 1000. (B) Equation 3 for N = 103 (solid line) and N = 107 (dashed line); note that the y-axis is log transformed.

