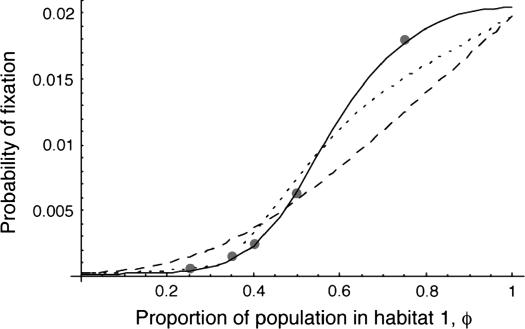
Figure 5.—
The probability of fixation in the two-deme model as a function of the relative population size of the two demes. The lines have the same meaning as in Figure 1, with the dashed line indicating the high-migration limit. Emigration rates are held constant for each individual at 0.025, which has the effect of increasing the backward migration rate for the smaller population relative to the larger population. Parameter values used are: N1 + N2 = 200, s1 = 0.01, and s2 = −0.005.

