Figure 1.
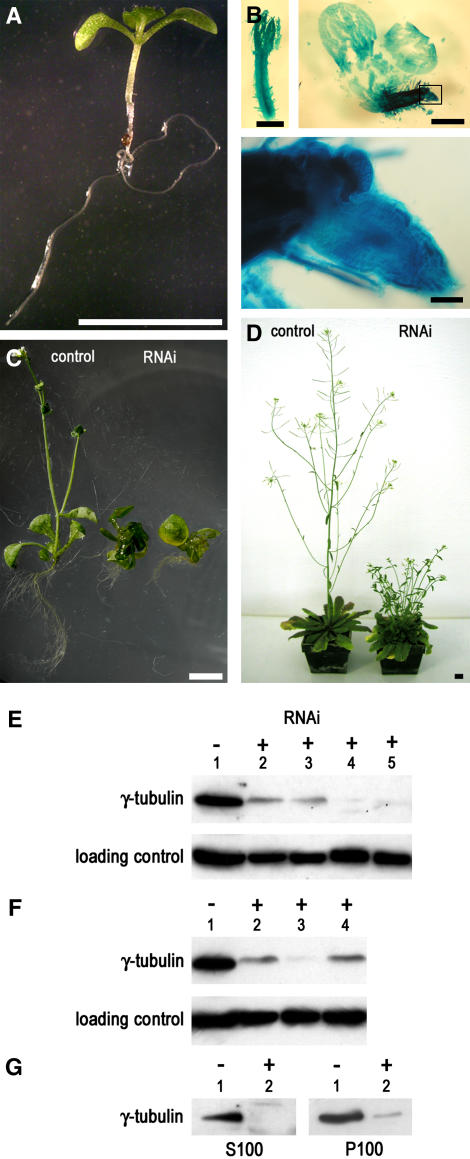
Developmental Abnormalities in Arabidopsis Lines with RNAi-Induced Downregulation of γ-Tubulin.
(A) Control uninduced Arabidopsis seedling transformed with dexamethasone-inducible RNAi construct 10 d after germination. Bar = 1 cm.
(B) Strong phenotype in a representative dexamethasone-induced RNAi γ-tubulin seedling, 10 d after germination on medium with dexamethasone, showing growth arrest and lethality at the cotyledon stage. Histochemical GUS staining revealed strong inducible expression of the coregulated marker. As shown at left and in the enlarged boxed area, the main root is arrested and new auxiliary meristems are activated. Bars = 1 mm.
(C) Mild RNAi phenotype in two representative dexamethasone-induced γ-tubulin RNAi seedlings. Shown are a control uninduced plant and two RNAi plants 20 d after induction with arrested development. Bar = 1 cm.
(D) Weak γ-tubulin RNAi phenotype with reduced elongation growth. Control and dexamethasone-induced γ-tubulin RNAi plants were grown in soil for 50 d under continuous dexamethasone treatment. Bar = 1 cm.
(E) Immunoblot analysis of γ-tubulin in total protein extracts from dexamethasone-inducible γ-tubulin RNAi plants with the strong phenotype as shown in (B) arrested at the cotyledon stage. Lane 1, uninduced control; lanes 2 and 3, pooled seedlings 5 d after induction; lanes 4 and 5, pooled seedlings 10 d after induction.
(F) γ-Tubulin in seedlings with the mild phenotype as shown in (C). γ-Tubulin was analyzed by immunoblotting in total protein extracts from individual γ-tubulin RNAi plants. Lane 1, uninduced control; lane 2, plants with dexamethasone-induced RNAi for 15 d; lane 3, dexamethasone induction for 20 d; lane 4, plants with ethanol-induced RNAi for 15 d. Samples were loaded at the same protein content (40 μg/lane). Shown are typical examples of protein gel blot analysis selected from ∼100 analyzed RNAi plants, all showing a corresponding reduction in γ-tubulin levels with the severity of the phenotypes.
(G) Distribution of γ-tubulin in cytoplasmic and membrane fractions from RNAi plants 15 d after induction. S100, high-speed supernatant; P100, microsomal pellet. Lane 1, uninduced control; lane 2, induced RNAi plant. To compare the relative distribution of γ-tubulin, pelleted material was resuspended in a volume equal to that of the corresponding supernatant.

