Figure 5.
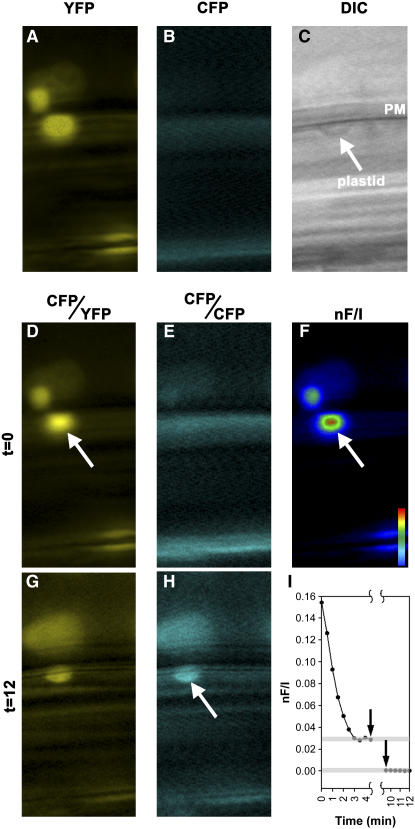
FRET Analysis of the GPA1–THF1 Interaction.
FRET between GPA1-CFP and THF1-YFP was calculated using established algorithms for two-filter FRET with fluorescence microscopy.
(A) to (C) Single images of cells expressing THF1-YFP (A) and GPA1-CFP (B) and a corresponding differential interference contrast (DIC) image (C), showing plasma membrane (PM) and a plastid.
(D) to (H) FRET images were recorded before ([D] to [F]) and after ([G] and [H]) acceptor photobleaching. Arrows denote the localization of the observed FRET signal where a plastid abutted the plasma membrane ([D] and [F]) and the region of CFP dequenching after YFP photobleaching (H).
(I) Quantification of the observed FRET signals. The first arrow denotes the start of the 480-nm irradiation, and the second arrow indicates the end.

