
Figure 3.
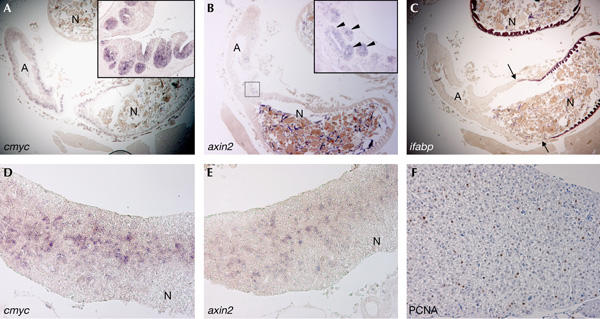
Upregulation of T-cell factor target genes in the adenomas of apc/+ fish. (A) Section of the intestine of a 20-month-old apc/+ fish containing a large intestinal adenoma (A) stained for cmyc. Cells in the adenoma express high levels of cmyc as compared with the normal intestinal tissue (N). The inset depicts a high-magnification image of a region of the adenoma in which most of the epithelial cells in crypt-like structures express high levels of cmyc (purple staining). (B) Serial section of the same intestinal adenoma stained for axin2. The inset depicts a high-magnification image of the boxed area of the adenoma. Epithelial cells in some crypt-like structures express high levels of axin2 (arrowheads). (C) Serial section of the intestinal adenoma stained for intestinal fatty acid-binding protein (ifabp). Note that in contrast to the normal intestinal tissue (N) that is positive for ifabp, the adenoma (demarcated by arrows) is negative for ifabp. (D) Diffuse hepatic neoplasia from a 14-month-old apc/+ fish stained for cmyc. Note that scattered cells in the adenoma are positive for cmyc, whereas those surrounding normal tissue (N) are negative. (E) Serial section of the same hepatic adenoma stained for axin2. Scattered cells in the neoplasia are positive for axin2. (F) Serial section of the same lesion stained for proliferating-cell nuclear antigen. Note scattered proliferative cells (brown staining). Original magnification: (A–C) × 20; (D,E) × 100; (F) × 200; insets in (A,B) × 200.