
Figure 3.
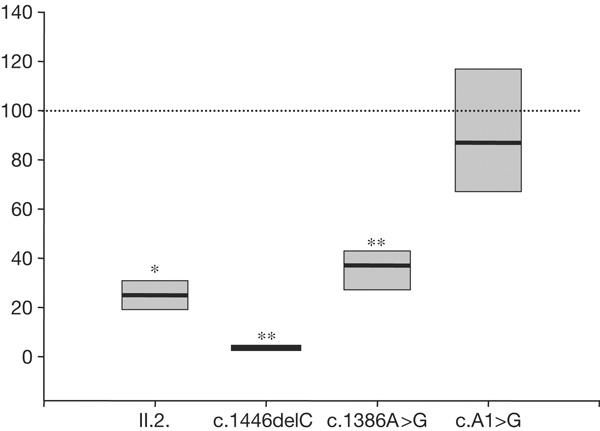
Selenoprotein N messenger RNA levels normalized to HPRT (hypoxanthine phosphoribosyltransferase) mRNA. Median values of several quantitative reverse transcription–PCR (n=7 for II-2; n=3 for the patients harbouring the c.1446delC, c.1386A>G and c.A1>G mutations) are presented ±deviation to 25–75%. Statistical significance was determined by a Mann–Whitney rank sum test (*P=0.001; **P=0.024).