
Figure 5.
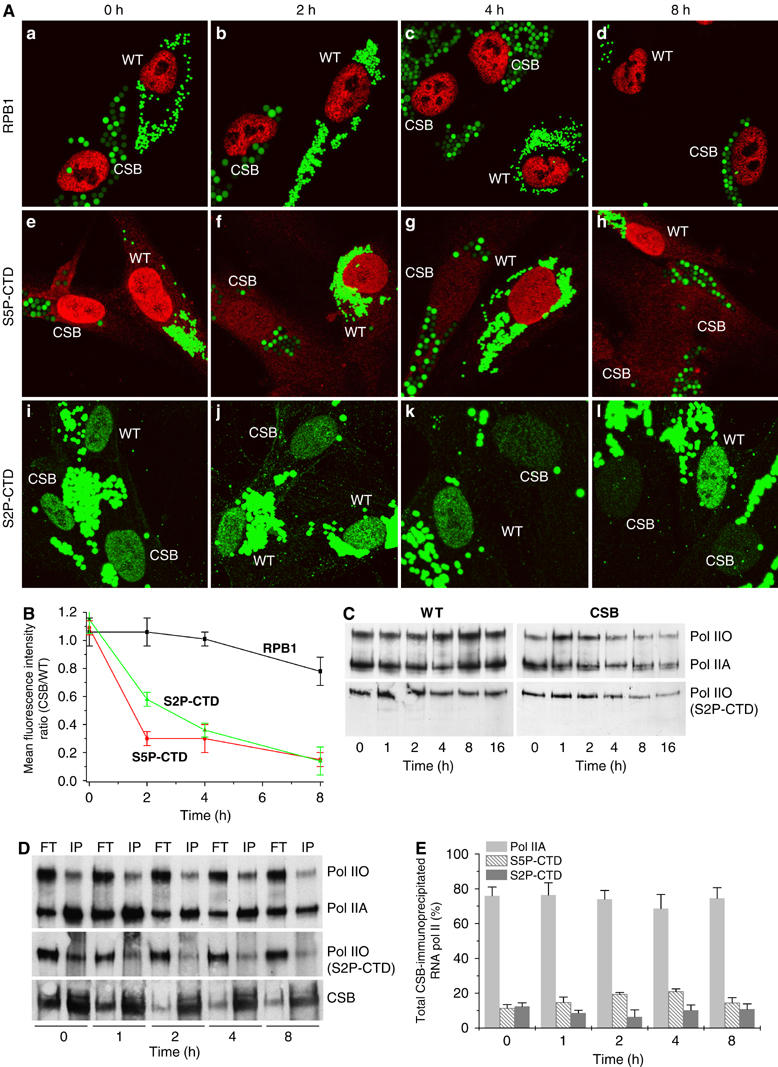
(A) Confocal microscopy analysis of RNA pol II concentration in WT or CS8PV cells using antibodies that recognize either RPB1, the largest subunit of RNA pol II (panels a–d), or the hyperphosphorylated CTD domain, at either serine 5 (S5P-CTD, panels e–h) or serine 2 (S2P-CTD, panels i–l). Cells were prelabelled with green latex fluorescent beads of different size and spotted on the same slide to further analysis of the RNA pol II concentration at the time indicated after UV irradiation (10 J/m2). (B) Graph represents mean fluorescent intensity (protein concentration) ratios calculated by dividing the mean fluorescence, relative to the protein staining, of CSB cells by the mean fluorescence of the WT cells as obtained by confocal scanner fluorescence, measuring of up to 100 cells. (C) Western blot analysis of RNA pol II amount from chromatin-bound fraction of either WT or CSB cells using antibodies that recognize RPB1, regardless its phosphorylation state (upper panel), or the phosphorylated S2P-CTD (lower panel). Pol IIO and Pol IIA indicate the hyper- and hypophosphorylated form of the CTD-RNA pol II, respectively. (D) Nuclear extracts from either unirradiated or UV-irradiated cells were immunoprecipitated (IP) using an antibody against CSB. The IP and the flowthrough (FT) fractions were analyzed by Western blot using antibody thaat recognize RPB1 (upper panel), the phosphorylated S2P-CTD RNA pol II (middle panel) or CSB (lower panel). (E) Graph represents the percentage of RNA pol IIA, and the phosphorylated S5P-CTD and S2P-CTD RNA pol II, which were CSB-IP at different time after UV irradiation.