
Figure 8.
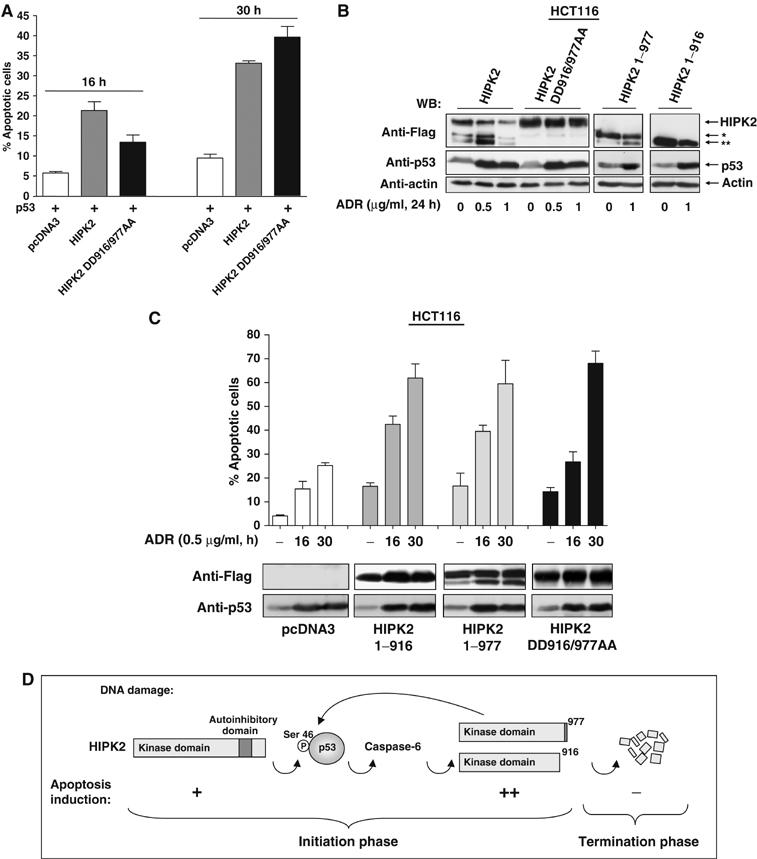
Functional analysis of apoptotic HIPK2* and HIPK2** activities. (A) H1299 cells were transfected with the indicated combinations of p53 and HIPK2 or HIPK2 DD916/977AA and analyzed for apoptosis after 16 and 30 h. Error bars show standard deviations. (B) HCT116 cells were transfected to express the indicated HIPK2 variants. The next day, cells were exposed for 24 h to adriamycin as shown. Cell extracts were analyzed by immunoblotting for HIPK2 processing and p53 accumulation. (C) HCT116 cells transfected to express the indicated HIPK2 proteins were treated for 16 or 30 h with adriamycin and then assayed for apoptosis, bars show standard deviations obtained from several independent experiments. Control blots ensured adequate expression of HIPK2 proteins and p53 induction. (D) Schematic diagram illustrating the pathways mediating p53 phosphorylation and activation, HIPK2 cleavage and apoptosis induction.