
Figure 2.
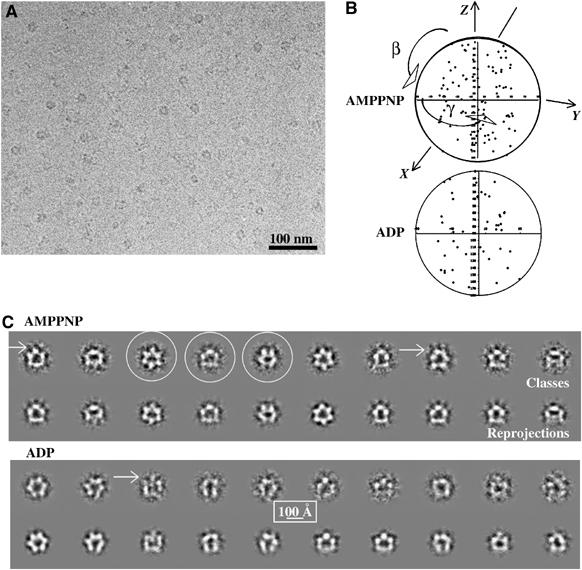
Cryo-EM and class averages of the p97–p47 complex. (A) Field of a cryomicrograph of p97–p47 incubated with AMPPNP showing a range of different views with protein density shown in black. (B) Distribution of viewing angles of the class sums used for calculating the 3D models of the p97–p47 complex in the AMPPNP and ADP conformations. The γ-angles are clustered between (−60°, +60°) because of the use of the three-fold symmetry. (C) For each nucleotide condition, the top row contains representative p97–p47 class averages (protein is shown in white) and the bottom row the corresponding reprojection of the 3D map in the direction of the orientation assigned to the average. For the complex in the presence of AMPPNP, three classes are circled that represent typical top, side and tilted views (left to right). The arrows point to small satellite densities that are connected to the rest of the particle.