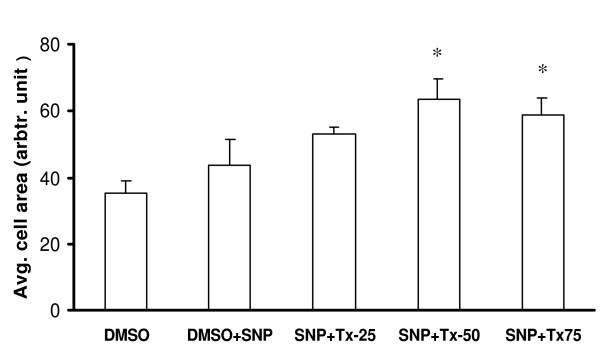
Figure 12.
Thalidomide induced expansion of SNP treated cells. An increase in average cell area was observed in the cells treated with 50 and 75 μg/ml thalidomide in comparison to that of only SNP treated cells. SNP, Tx25, Tx50 and Tx75 denote 500 μmol SNP, 25, 50 and 75 μg/ml thalidomide respectively. The asterisks represent the level of significance. * P < 0.05 compared to control.

