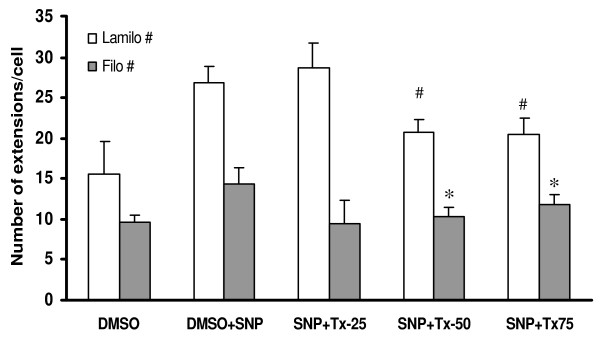
Figure 13.
Thalidomide arrested SNP mediated formation of extensions inECs. The graph shows that SNP induced formation of lamellipodia and filopodia in comparison to that of DMSO (control) treated cells (data not shown). A further challenge with 25, 50 and 75 μg/ml thalidomide caused a decrease in the number of lamellipodia and filopodia structures in comparison to that of SNP treated cells from 50 and 75 μg/ml groups. SNP, Tx25, Tx50 and Tx75 denote 500 μmol SNP, 25, 50 and 75 μg/ml thalidomide respectively. # and * represents the level of significance for the change of the number of filopodia and lamellipodia respectively when compared that with only SNP groups.

