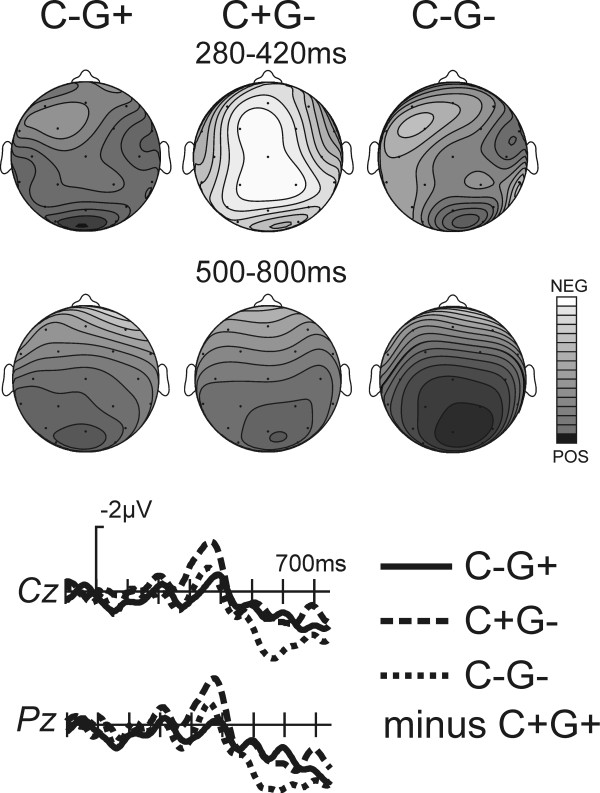
Figure 2.

German study: Difference waves obtained by subtracting the correct condition waveforms from the various other conditions are illustrated at the bottom of the figure. The top row shows spline-interpolated isovoltage maps based on mean amplitude values of the difference waveforms (condition minus (C+G+)) in the 280–420 ms time window (these maps scaled with 0.3 μV as maximum and -1.1 μV as minimum). The middle row illustrates similar isovoltage maps for the 500–800 ms time-window, i.e. the P600 time range (these maps scaled with 1.6 μV as maximum and -0.7 μV as minimum).
