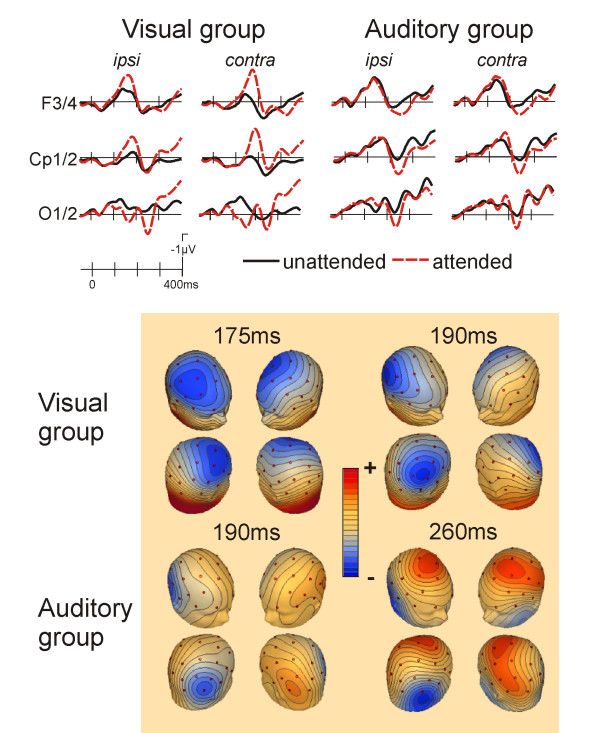
Figure 1.

Grand average ERPs to visual standard stimuli for selected scalp sites and isovoltage scalp-maps (attended location ERPs minus unattended location ERPs; contralateral is right on these maps). The two left columns show the effect of spatial attention on the visual ERP in the "attend visual" group. A clear contralaterally distributed P1 component was seen at occipital electrodes, followed by an anterior N1 attention effect (seen at the F3/4 sites; upper left group of maps) and a somewhat later posterior N1 attention effect (seen at Cp1/2, upper right group of maps). Subsequent to the modulation of the P1, a second more ipsilateral positivity was present in the occipital channel with a peak latency of 250 ms. The right two columns depict the crossmodal effects of spatial auditory attention on visual ERPs in the "attend auditory" group. Here, no clear P1 modulation was present. Instead, only the second positivity at 260 ms was present in the occipital channels (see lower right group of maps). The frontal N1 effect seen in the visual group was greatly attenuated. Instead, visual standards at the attended location showed a positive displacement from 200 ms onwards at frontocentral sites. The posterior N1 clearly showed a modulation as a function of auditory spatial attention (see lower left group of maps). Maps depict the spline interpolated amplitudes at the specific time-points given.
