
Figure 1.
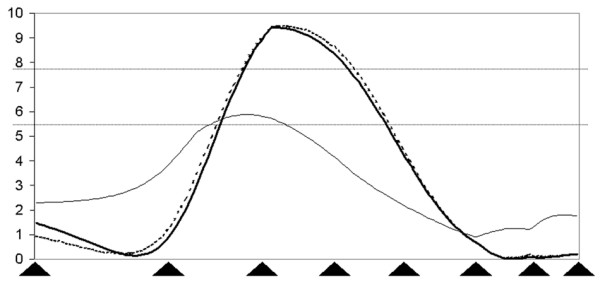
Plot of the F-ratio from least square interval mapping for evidence of QTL for DIAFTG ( ) and DIAmean (
 ) as well as C1ML (
 ) on SSC2. The x-axis indicates the relative position on the linkage map. The y-axis represents the F-value. Arrows on the x-axis indicate the position of markers (SW2443, FTH1, SW240, STS2, C3, SW1564, BHMT, S0226). Lines indicate the 5% genome-wide and 5% chromosome-wide significance thresholds.