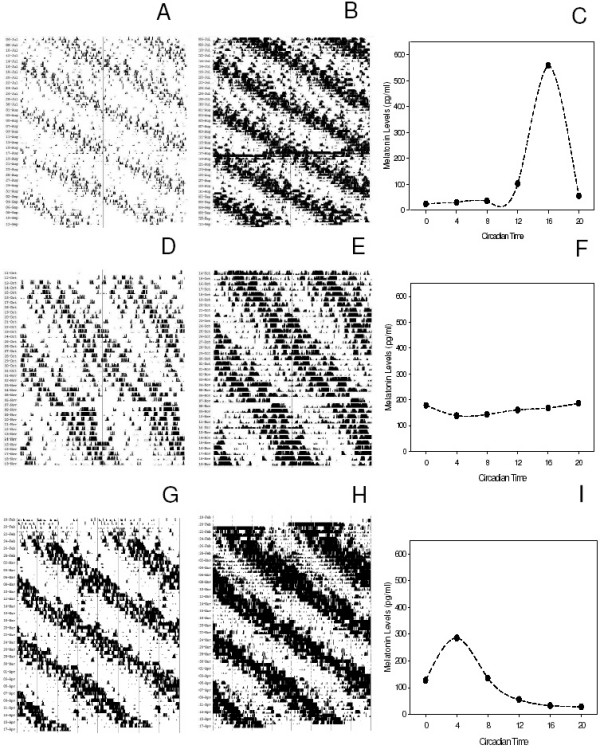
Figure 1.

Representative actograms of Rw, Tb and serum melatonin profile. A, B, C: a synchronized animal (rat # 1 in Table 1); D, E. F: an animal with a damped melatonin rhythm (rat # 5 in Table 1); G, H, I: a desynchronized animal (rat # 21 in Table 1). Plots D and E show only the last 40 days of the experiment.
