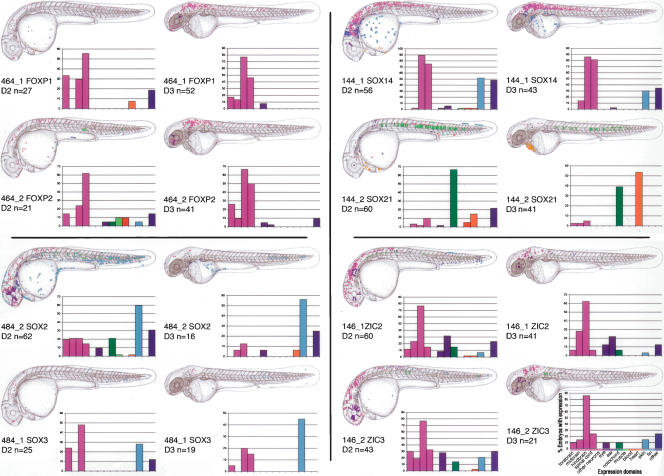
Figure 6.
dCNEs direct GFP reporter gene expression in specific tissues. For each dCNE, cumulative GFP expression data is pooled from a number of embryos (n ≥ 20 expressing embryos per dCNE on day 2 of development). Embryos are examined for GFP expression at ∼26–30 hpf and 50–54 hpf and schematically overlaid on camera lucida drawings of 2- and 3-day-old zebrafish embryos. Different cell types are color-coded, and the same key is used for all panels. Both the color code and the key are displayed under the day 3 chart for dCNE 146_2. Graphs encompass the same data set as the schematics and display the percentage of GFP-expressing embryos that show expression in each tissue category for a given dCNE. The total number of expressing embryos analyzed per CNE is displayed just below the schematic in each case. FOXP1/FOXP2 dCNEs 461_1 and 461_2 did not up-regulate GFP expression in this assay.

