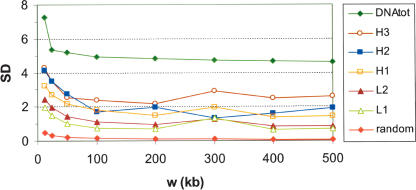
Figure 2.
Plots of average standard deviations of GC within isochore families versus window size. Plots of standard deviation (SD) of GC versus fixed window sizes (w) ranging from 12.5 to 500 kb are shown for all isochores comprising at least four windows, after partitioning isochores into families according to GC level. The plots summarize the compositional variations within isochore families. At all scales, these are lower than that characterizing the whole genome, that is, all isochores (top curve), yet much higher than those of random sequences (bottom curve). The variations are consistently high for window sizes below 100 kb, and settle down to a plateau for larger window sizes. This fact justifies graining at 100 kb (see text). Marginally higher standard deviations around 300-kb windows may be due to a larger number of isochore borders seen through this window (Supplemental Fig. S2 shows a size peak of isochores around 500 kb).

