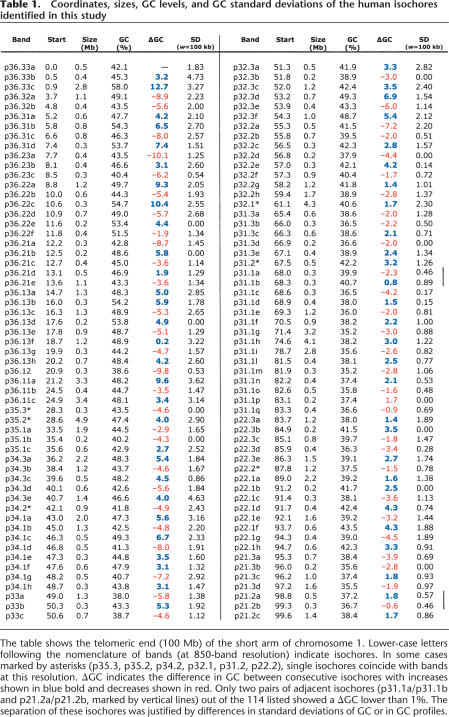
Table 1.
Coordinates, sizes, GC levels, and GC standard deviations of the human isochores identified in this study
The table shows the telomeric end (100 Mb) of the short arm of chromosome 1. Lower-case letters following the nomenclature of bands (at 850-band resolution) indicate isochores. In some cases marked by asterisks (p35.3, p35.2, p34.2, p32.1, p31.2, p22.2), single isochores coincide with bands at this resolution. ΔGC indicates the difference in GC between consecutive isochores with increases shown in blue bold and decreases shown in red. Only two pairs of adjacent isochores (p31.1a/p31.1b and p21.2a/p21.2b, marked by vertical lines) out of the 114 listed showed a ΔGC lower than 1%. The separation of these isochores was justified by differences in standard deviations of GC or in GC profiles.

