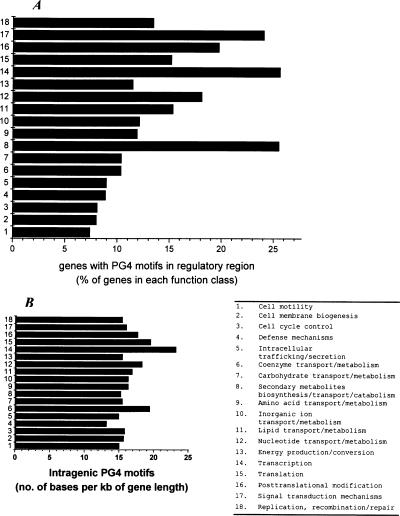
Figure 3.
Genes harboring PG4 motifs in their regulatory region show distinct functional distribution in a comparative analysis comprising 37,974 ORFs from 18 organisms. (A) The distribution of genes with at least one PG4 motif within the −200-bp region is shown as the percentage of total genes in the respective function class—secondary metabolite biosynthesis, transcription, and translation related genes show significant difference (P < 0.004). (B) The intragenic PG4 motif density indicates that the distribution is not significantly different across the functional classes (P = 0.108). The PG4 motif density was calculated as the number of bases involved in motif formation per kilobase of gene length. Two classes, chromatin structure and dynamics and RNA processing and modification, which constitute only 0.054% and 0.09% of the distribution, were not included in the plots. Extracellular structure, nuclear structure, and cytoskeleton genes do not have any motifs in their regulatory regions. Undefined classes like function unknown and general function prediction have been excluded from analysis along with genes not found in the COGS database. All function information was obtained from the COGS database. A plot showing distribution across the functional classes with respect to the total ORFs (5574) with PG4 motifs in −200-bp regions is shown in Supplemental Figure S5.

