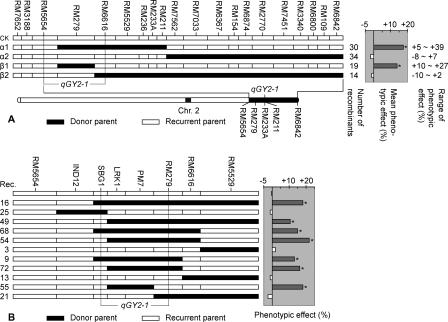
Figure 1.
Fine mapping and physical positioning of qGY2–1. (A) Phenotypic analysis of the recombination groups in the short arm of chromosome 2 near SSR marker RM233A. Each group is composed of families whose genotype is represented by a bar divided into black (Dongxiang wild rice, Oryza rufipogon) and empty (Guichao2, Oryza sativa ssp. indica) segments. The genomic composition of the α1, β1 group and α2, β2 group are, respectively, defined by the shortest and the longest O. rufipogon segments detected in the included recombinant families. The borders between bars are arbitrarily drawn midway between positive and negative markers for the introgressed O. rufipogon segment. To the right are the number of recombinants in the group, the mean phenotypic effect of the group, and the minimum and maximum effects in the included families. An asterisk indicates that the phenotypic effect of each of the included families was significant (P < 0.05). The genetically mapped interval of qGY2–1 is indicated by broken lines. (B) Genotypic and phenotypic analysis of 11 recombinant families. Asterisks in the right panel denote a significant phenotypic effect (P < 0.05). The physical location of qGY2–1 is indicated by a broken line between SBG1 and RM279.

