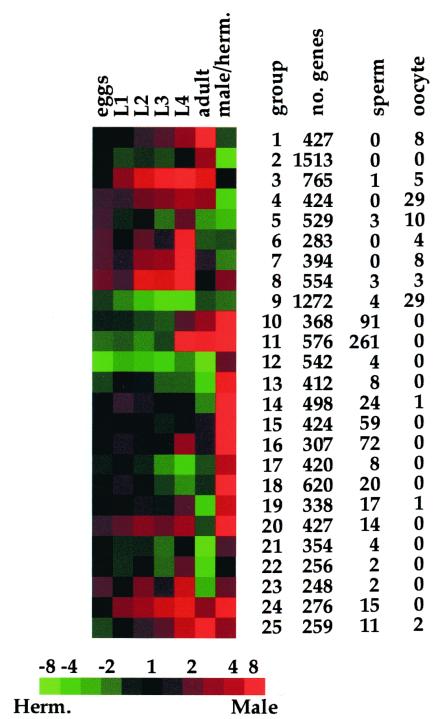
Figure 1.
A global profile of gene expression during development. Of the entire set of 17,871 genes, 12,486 showed at least a 2-fold difference in expression during development or in the two sexes. The noncentered Pearson correlation was calculated between each pair-wise combination of these genes and used to place them into a self-organizing map with 25 nodes (a 5 × 5 grid) using 105 reiterations. Details about the self-organizing map and its source code can be found at http://genome-www.stanford.edu/∼sherlock/cluster.html. The total number of genes, the number of sperm-enriched genes, and the number of oocyte-enriched genes in each group are shown. A detailed list of the genes in each expression group can be found at http://cmgm.stanford.edu/∼kimlab/dev. For the developmental time course, samples from developmental stages are compared with reference RNA, and for sex regulation, samples from males are compared with those from hermaphrodites. Red indicates more abundant than the reference RNA or enriched in males. Green indicates less abundant than the reference RNA or hermaphrodite enriched. Scale shows level of expression (fold expression) as varying shades of color.

