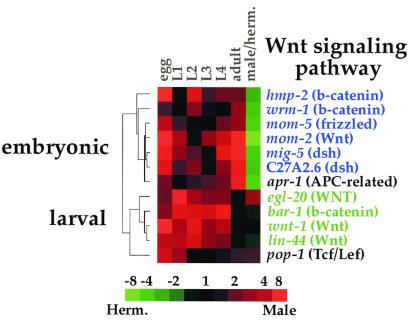
Figure 4.
Developmental expression of Wnt signaling genes. The hierarchical tree shows the degree of similarity of the expression patterns. The embryonic expression group is shown in blue, and the larval expression group is shown in green. Developmental expression levels are normalized, such that each stage is compared with the stage with the lowest level. Scale shows level of expression.

