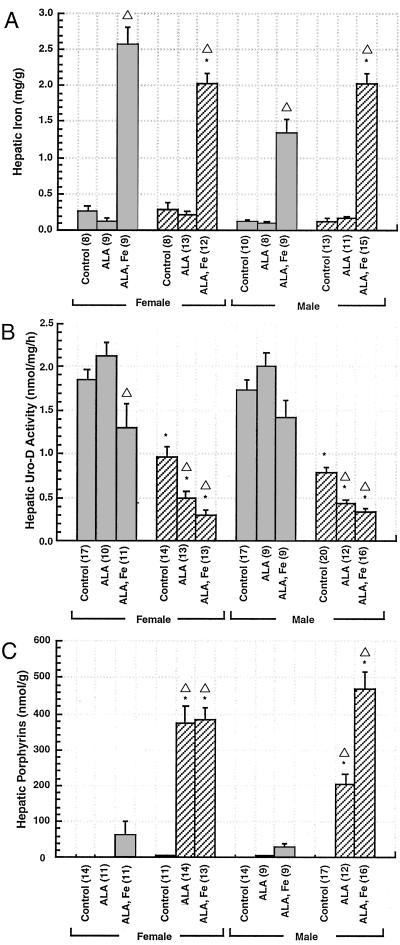
Figure 4.
Hepatic iron, URO-D activity, and porphyrin content in wt and URO-D+/− mice 3 weeks after treatment with ALA or ALA plus iron (A) Hepatic iron concentration, determined by atomic absorption spectroscopy. (B) Hepatic URO-D activity determined on cytosolic extracts. (C) Total hepatic porphyrin concentration. The numbers in parentheses in A–C represent the number of animals in each group. ■, wt; ▨, URO-D+/−. * indicates a value significantly different from wt. ▵ indicates a value significantly different from control animals in the same group. Error bars represent the standard error of the mean.

